The benefits of Microsoft Excel 2013
During the past few weeks, I have been writing blog posts about the benefits of the applications in the new Microsoft Office 2013. Even though there are a lot of great new enhancements in Word, PowerPoint, Outlook and OneNote that will for sure increase productivity, Microsoft Excel 2013 is in a league by itself. You will be amazed by the clever new functionality that, not only will save you a lot of time, but also help you produce better results. In this blog post, I’ll share with you my five personal favorite benefits of Microsoft Excel 2013.
1. Finish you spreadsheets faster using “Flash Fill”
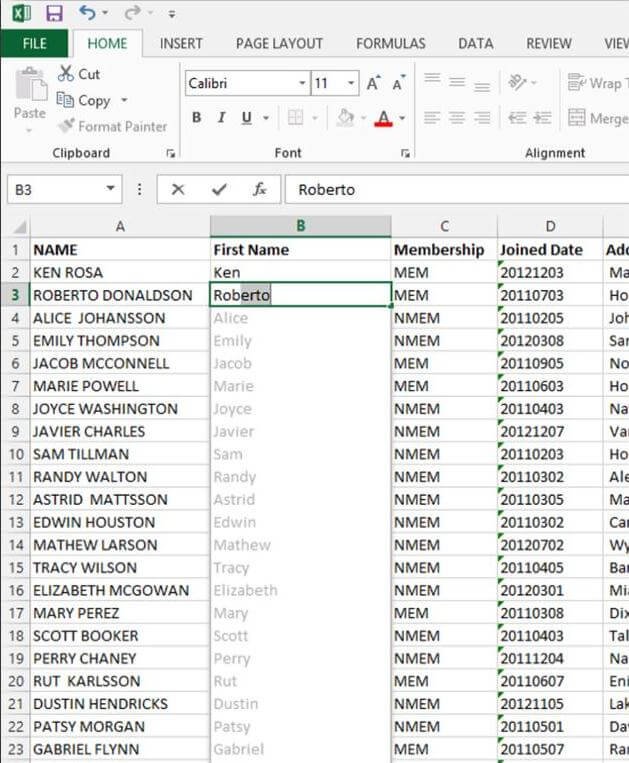
 There have always been a large number of tools available in Excel to modify and clean up data. The problem is that most normal users don’t perform these tasks very often. When they do, they don’t know how to use the tools so they end up cleaning the data up by hand instead. This is where Microsoft Excel 2013 works its’ magic. Let me give you an example. Imagine you have a column with names in capital letters (like the image on the right). You want to split this up into two columns– one with the first name and one with the last name, and you only want the first letters to be capitalized. In Excel 2013 you can just start writing the names the way you want them in the first couple of cells and then Excel 2013 fills the rest of the range for you! The “Flash Fill” algorithm understands a number of different patterns and if it doesn’t understand completely, you can just add a couple more cells the way you want them and Excel 2013 will try again. This will without a doubt save you a lot of time and you will be able to finish your spreadsheets a lot faster.
2. Understand your data better using “Quick Analysis”
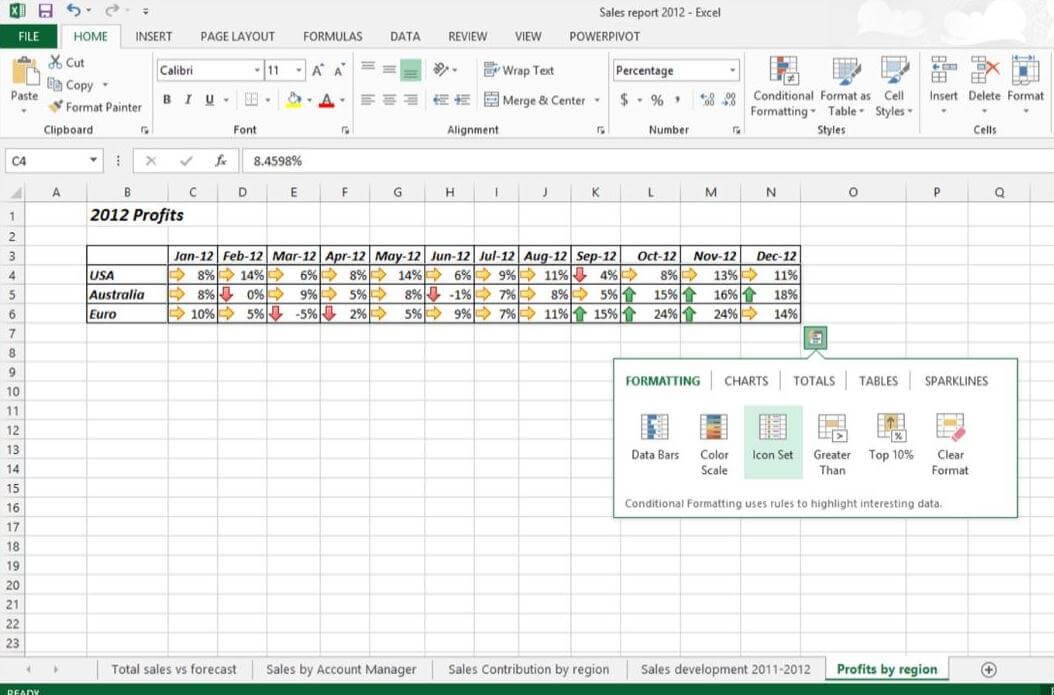
One of the many strengths of Microsoft Excel is the ability to analyze data. You can look at data from many different angles to provide insights – in tables with colored cells or arrows using conditional formatting, in various charts, in PivotTables and so on. No doubt you can spend a lot of time creating these different views of your data to get a better understanding of it. In Excel 2013 Microsoft has introduced something called “Quick Analysis”. This is a nifty tool that appears as soon as you mark a set of data in your spreadsheet. From the QuickAnalysis menu you can get a live preview of different formatting, charting, and layout options that can help you get better insights into your data. You don’t have to step through various menu options on the ribbon to analyze your data; you can quickly do it hardly moving your mouse.
3. Feel at ease using charts
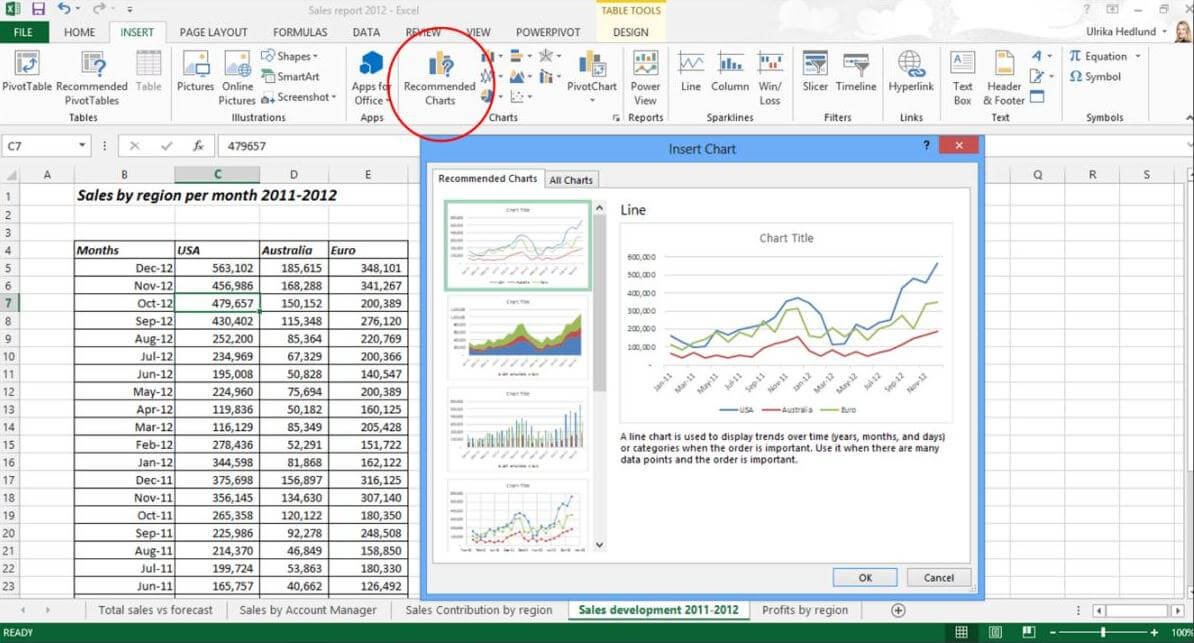
Using charts in Excel often intimidates people. Memories from high school pop up in your head and you break a sweat remembering you math-teacher scolding you because you got the Y-axis and X-axis mixed up. Or you’re worried that the Excel-guru in your team will see your report and smile mischievously because the chart type you chose doesn’t properly represent the data. With Excel 2013 you can feel at ease inserting charts in your report. Excel 2013 will analyze your data and recommend chart types that are best suited for the data set you have. You can then select one of the recommended charts and insert it into your spreadsheet.
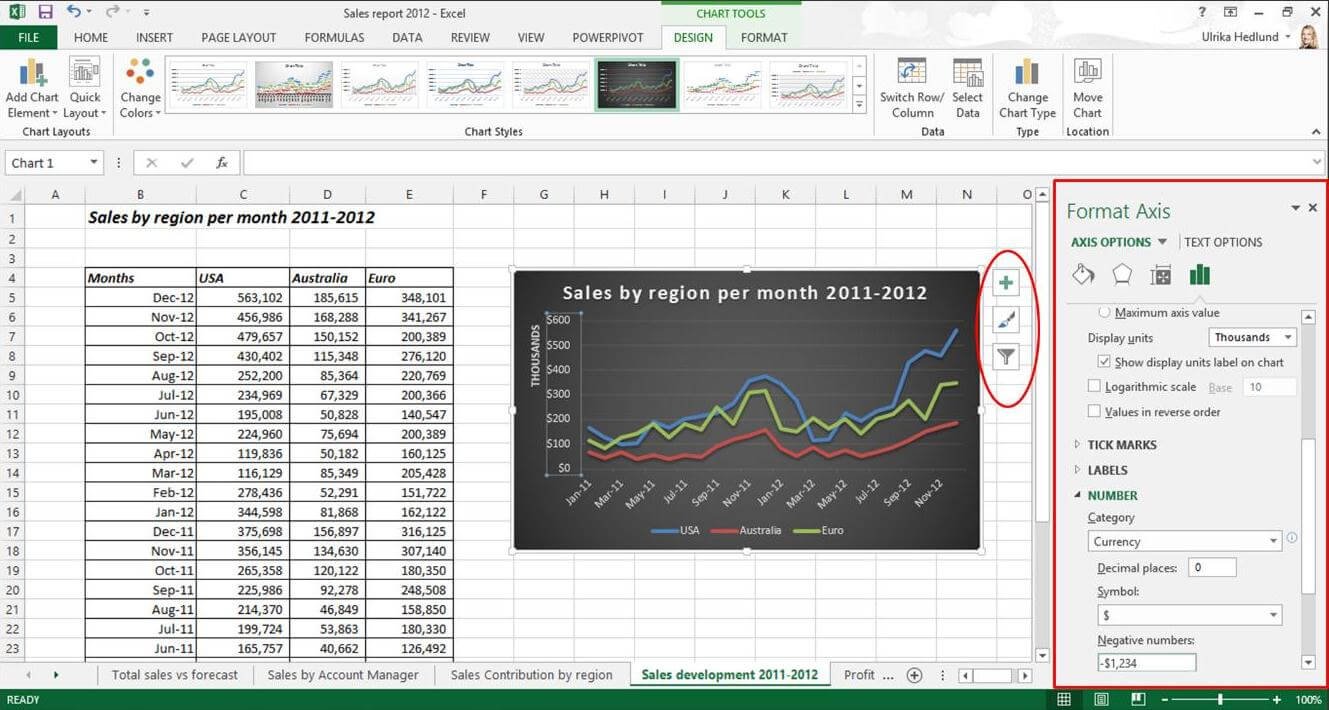
When you have inserted one of the recommended charts you can make modifications to the charts by clicking one of the three buttons that now appear next to your chart. A formatting pane opens up where you can select between various options to customize your chart.
4. Easily collect feedback using Excel Surveys
Quite frequently you need to gather feedback from people on certain topics. You might want feedback from customers after attending an event you’ve hosted, you might need input from your business partners on proposed business initiatives or you want recommendations from your team members on a restaurant for your off-site. There are lots of ways in which you can collect data, you can use a SharePoint survey, you can use option buttons in an Outlook email or you can use an external service like SurveyMonkey. There are pros and cons to all these options, but there definitely is room for an easy way to do this using Excel. Now, you can easily create a survey that is accessible to anyone over the Internet using Microsoft Excel 2013 and SkyDrive (at the time of writing this blog this functionality has not been rolled out to all SkyDrive users yet). You just go to SkyDrive and click “Create – Excel Survey”.
A guide opens up where you can add questions to your survey. When you are done you get a link that you can share with anyone who has access to the Internet. Finally, when people have filled out your survey, the answers are automatically inserted into an Excel spreadsheet where you can analyze the responses. Very easy and extremely powerful!
5. Save money using Excel for your all your “Business Intelligence”
The benefits I’ve mentioned above are great for novice users who undoubtedly will be more empowered using Excel 2013. But what about the Excel power users? Are there any benefits for them? The answer is yes! Those of you who use Microsoft Excel as the tool of choice to analyze large sets of complex data stored in databases or in various spreadsheets will be very pleased with the new data modeling and visualization capabilities in Microsoft Excel 2013. A number of advanced reporting tools that were previously available as add-ins for Excel are now built into Excel 2013. Now you can create great looking reports and dashboards by inserting a “Power View” into your spreadsheet. The Power View takes advantage or Microsoft’s Silverlight technology and online services such as the Bing mapping service to create more advanced reports.

With the more advanced data modeling capabilities of Microsoft Excel 2013, you can add multiple data sets and define relationships between data. For every release of Office, Microsoft has added business intelligence (the ability to turn raw data stored in the organization into meaningful business insights) capabilities into Excel. Still, many organizations have required third-party tools to fulfill their business intelligence needs. With Microsoft Excel 2013 Pro Plus, organizations will be able to save money by streamlining their application portfolio.
Even more benefits for enterprises
In addition to the benefits mentioned above, Excel 2013 provides a new ability for large organizations to keep track of and manage their many business critical excel spreadsheets that are spread out within the organization. In 2011, Microsoft acquired the Prodiance Corporation a company focused on spreadsheet control. Using this technology, organizations can now track down spreadsheets, analyze them and manage them so that the risk of errors that could potentially hurt the company financially are eliminated.
As you can see there is a lot of great new functionality in Microsoft Excel 2013 and still, there are a lot of things I haven’t covered. Stay tuned for our upcoming productivity videos on Microsoft Excel 2013.
(If you have difficulties reading this article, you can access the full article in pdf here)


